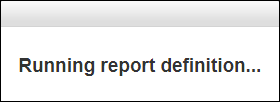
The screen will refresh as the report is building. You may see messages that say, “Running report definition…”, “Gathering results… this may take a few minutes.”, and/or “Loading results…” When this happens, please be patient while the report is still building.


A "Still Running" status message will appear at the bottom of the page while the report is being created. You can still change pages, change the report criteria, or reconfigure the report during this time. The final formatting will be displayed after the report has been downloaded.
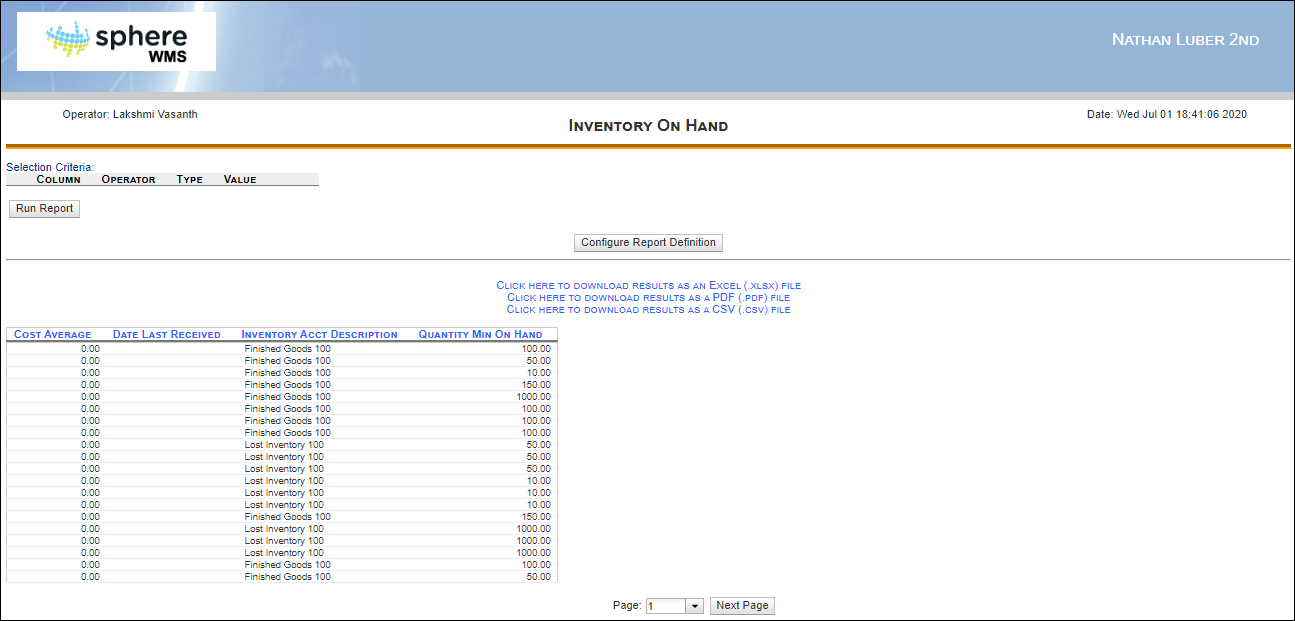
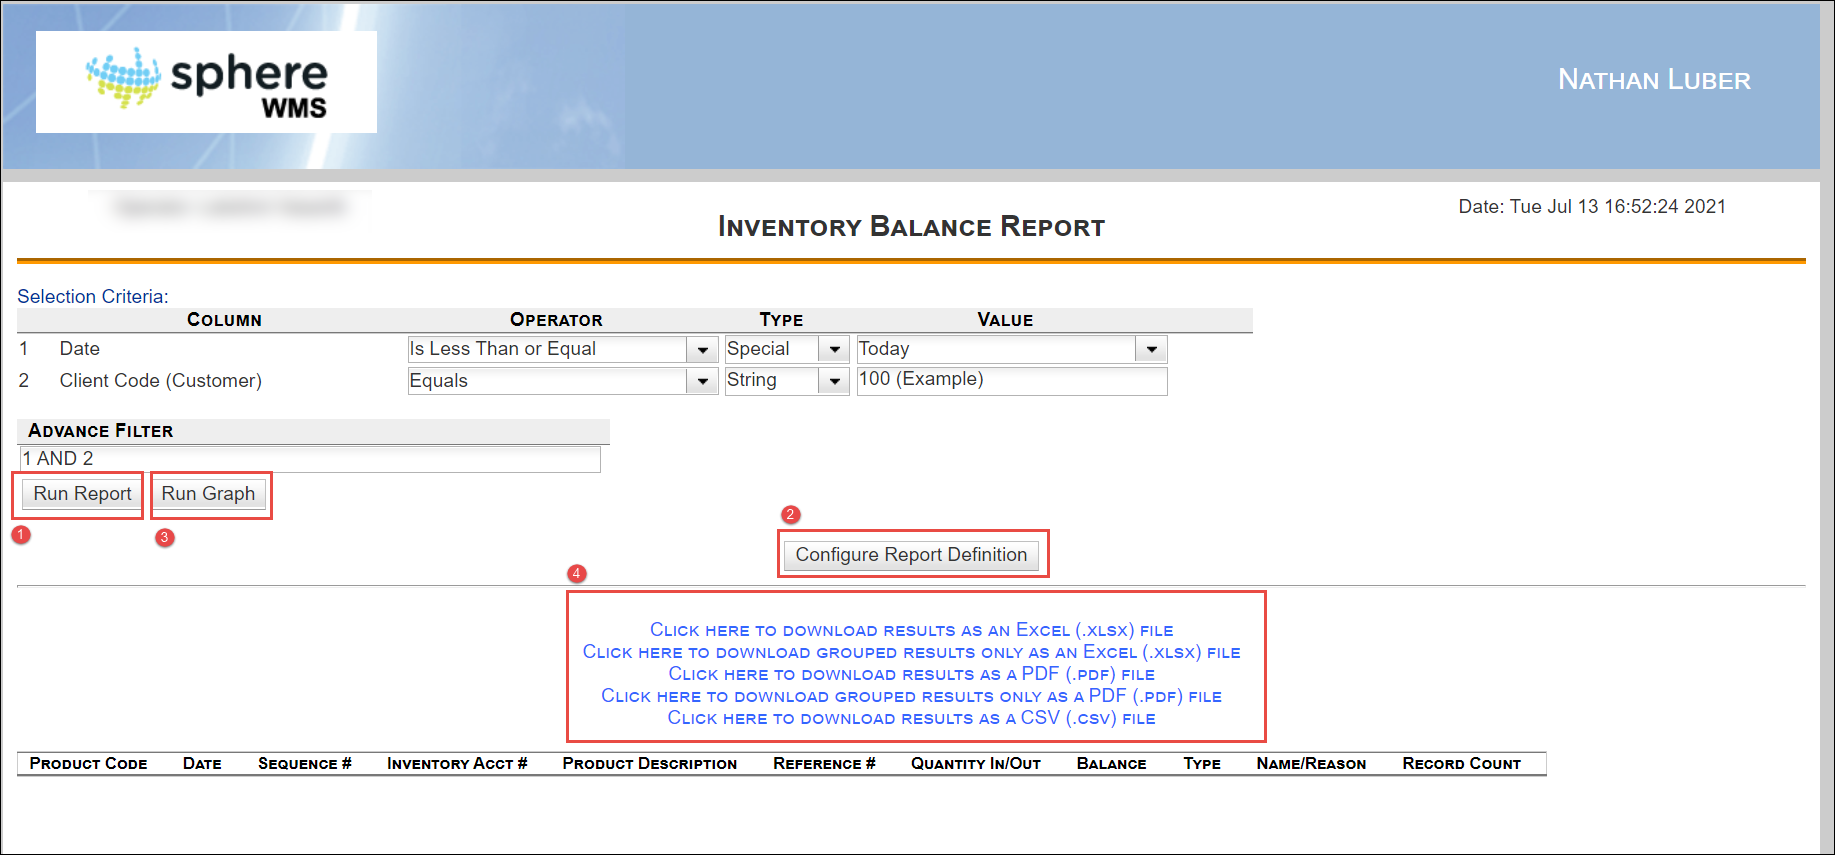
1. From here, you have several different options for viewing and reconfiguring the report. Once the changes are made, you may have to press the Run Report button to see those changes displayed.
2. If you want to go back to change some of the original configurations of the report, then you can simply click the Configure Report Definition button.

Viewing Grouped Items
If grouping items as part of the configuration (Step 5), then the items in the report will appear in blue rows. These rows contain the group items. If you want to see the listed items in the group, click anywhere on the appropriate blue row.
3. Viewing the Graphs
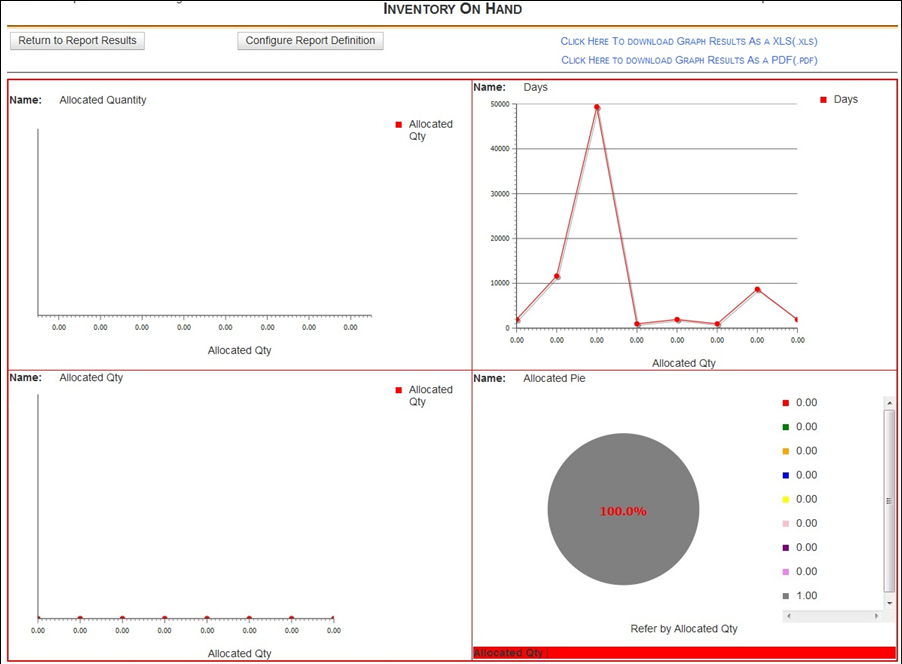
If graphs were selected to be part of the report, click the Run Graph button to view them. Once this button is pressed, you will be taken to another page to view the graph(s).

While here, you have a few options: If you wish to go back to the screen to view the compiled report, simply click the Return to Report Results button. If you desire to change the original configurations of the report, just click the Configure Report Definitions button. If you want to save or export the graphs, there are two options: Just click on the blue text indicating whether or not to save it as an Excel file (XLS) or a PDF.
Sorting the Report
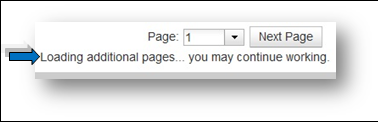
All the information is sorted into columns. You can re-sort the columns by clicking on the column headers. At first, this option may not be available as the report is still being compiled. This is true when the column headers are bolded in black. You can also see the message, “Loading additional pages… you may continue working.” at the bottom of the page.

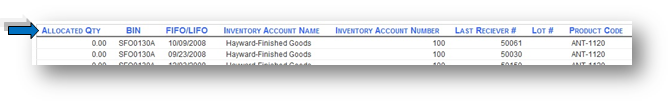
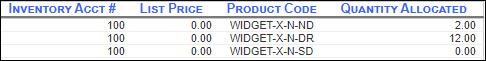
Once all the information is fully loaded, sorting can be done on the fly by clicking on the column headers (Column headers will be bolded in blue when the report is fully compiled, allowing the ability to be clicked and sorted).
4. Saving the Report Results
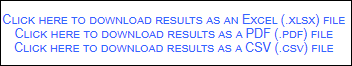
The results can be saved in three different formats: an Excel file, a PDF, or a Comma Separated Values (CVS) format. Simply click on the appropriate blue text.
